Highlights
Obesity is defined as excess fat accumulation that presents a risk to health. Obesity is commonly diagnosed using body mass index (BMI), which estimates the level of fat tissue based on height and weight.
These researchers showed that measurements of body composition are more accurate than BMI at predicting levels of fat accumulation and potential health risks.
Based on these results, the researchers recommend that body composition measurements become the new standard for diagnosing obesity. Future work will focus on predictors of obesity-related health risks in children and adolescents such as fat deposits in the liver.
According to the World Health Organization,
obesity
has reached
epidemic proportions, with an estimated 4 million people dying each year as a result. The European Association for the Study of Obesity estimates that the number of people living with obesity has doubled since 1980. In the United States, nearly 42% of adults and 20% of children and adolescents were classified as obese between 2017 and 2020 according to the US Centers for Disease Control and Prevention (CDC).
Obesity is defined by the World Health Organization as “excess fat accumulation that presents a risk to health.” It is commonly diagnosed using a tool called
body mass index,
or BMI, which uses your weight and height as an estimate for excess fat accumulation. However, new research by Dr. Yftach Gepner and colleagues at Tel Aviv University in Tel Aviv, Israel shows that BMI is not a
sensitive method to estimate body fat and can often lead to misdiagnosis. Instead, Dr. Gepner recommends using new technologies to directly measure
body composition and fat content to diagnose obesity more accurately.
Body Mass Index (BMI)
The concept of BMI was first developed in the 1830s by Adolphe Quetlet, a Belgian mathematician who wanted a formula to characterize the "average man." This formula—weight (in kilograms) divided by height (in meters) squared—was popularized in the US by Ancel Keys, a
physiologist.
Dr. Keys published his research in a 1972 study based on data from over 7,000 mostly middle-aged, white men to create the BMI classifications used today. The history of the development of BMI raises questions about its usefulness for people from different ethnic and racial backgrounds, genders, and ages.
The CDC has an online tool to calculate BMI that classifies an individual as underweight, normal weight, overweight, or obese. In adults aged 20 and older, the calculation is based solely on height and weight.
| BMI |
Weight Status |
| Below 18.5 |
Underweight |
| 18.5-24.9 |
Healthy weight |
| 25-29.9 |
Overweight |
| Over 30 |
Obese |
Table 1. Weight status according to BMI in adults 20 years of age and older.
[Source: https://www.cdc.gov/healthyweight/assessing/index.html #:~:text=If%20your%20BMI%20is%20less,falls%20within%20the%20obese%20range]
Although BMI in children and adolescents is calculated using the same formula as adults, the results are interpreted differently. This is because weight and height change with age, and the relationship between BMI and the amount of fat tissue in the body also changes with age. For these reasons, BMI results for children and adolescents are shown as a
percentile
relative to others of the same age and sex. The percentile shows the percentage of individuals who have results above or below you. For example, if your result is in the 50th percentile, this means that 50% of youth of the same age and sex have a lower BMI and 50% have a higher BMI. The 85th percentile means that 85% of youth of the same age and sex have a lower BMI and 15% have a higher BMI.
| BMI (Percentile) |
Weight Status |
| Below 5th |
Underweight |
| Between 5th and 85th |
Healthy weight |
| 85th to 95th |
Overweight |
| 95th or greater |
Obese |
Table 2. Weight status according to BMI in children and adolescents under 20 years old.
[Source: https://www.cdc.gov/healthyweight/assessing/bmi/childrens_bmi/about_childrens_bmi.html]
You can use the CDC's tool for children and adolescents to calculate your BMI and weight status and see how it compares to others. The CDC tool allows you to see your results on a growth chart. In the chart below, you can see how a 10-year-old and 15-year-old boy have the same BMI but different weight status.
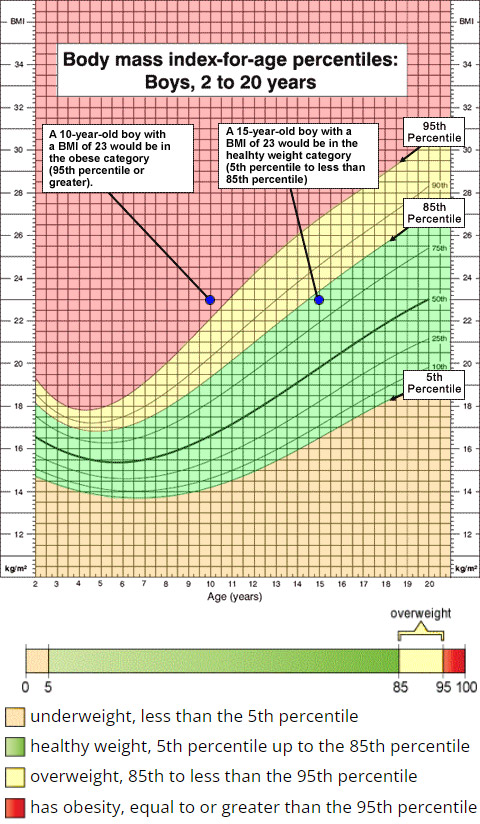
Figure 1. Weight status for a 10-year-old and 15-year-old boy with a BMI of 23. In children and adolescents, BMI results are interpreted in comparison to others of the same age and sex.
[Source: https://www.cdc.gov/healthyweight/assessing/bmi/ childrens_bmi/about_childrens_bmi.html#healthy-weight-ranges]
Keep in mind that the CDC's current tool for children and teens is in the process of being updated to reflect obesity data more accurately. As will be discussed in the next section, BMI is an estimate, not a measurement, of weight status. If you have any questions or concerns about your weight status, talk to the adults in your life and seek guidance from your pediatrician.
Limitations of BMI
BMI has been used to estimate health status and diagnose obesity at the individual level for decades. However, BMI is most useful as a tool to measure trends in obesity across populations over time, not in individuals. In June 2023, the American Medical Association (AMA), a professional organization of doctors in the US, updated their guidance for the use of BMI with individual patients. They acknowledged flaws with BMI including that it does not account for differences based on race, ethnicity, sex (in adults), or age (in adults).
The AMA now recommends that BMI only be used together with other measures of obesity risk such as
waist circumference
and body composition. Weight circumference measures abdominal size. You can easily measure weight circumference by wrapping a tape measure around the waist just above the belly button. Body composition will be discussed in the next section.
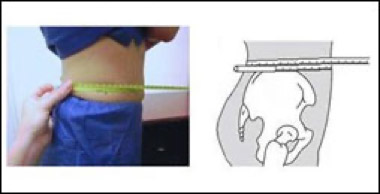
Figure 2. Measuring waist circumference.
[Source: https://www.cdc.gov/healthyweight/assessing/index.html]
"From a scientific perspective, the fundamental problem with using BMI to diagnosis obesity is that it is an estimation," commented Dr. Gepner, Professor in the School of Public Health at Tel Aviv University, Tel Aviv, Israel. "For this new century, we need to actually measure—not just estimate—the amount of fat tissue in the body."
Body Composition
One reason that BMI may be a poor indicator of health status is that weight does not tell the whole story. Fat is only one of the major components of body mass. Other components of body mass include bone, muscle, organs, and water. Together, they are called fat-free mass. The relative proportions of fat and fat-free mass are called body composition.
Fat plays an essential role in many physiological processes in the body. However, either too much or too little fat mass can have negative health consequences. Too little body fat can lead to vitamin deficiencies,
osteoporosis,
and decreased immune function. On the other hand, excess body fat can increase the risk of
heart disease,
diabetes,
and
cancer,
among other diseases. The clear association between obesity and health risks is one reason that tools like BMI have been used so commonly.
Measuring Fat Mass
Although BMI is often used to estimate body composition, there are several tools that can measure fat mass directly. The gold standard for measuring body composition is an imaging technique called
dual x-ray absorptiometry
(DXA).
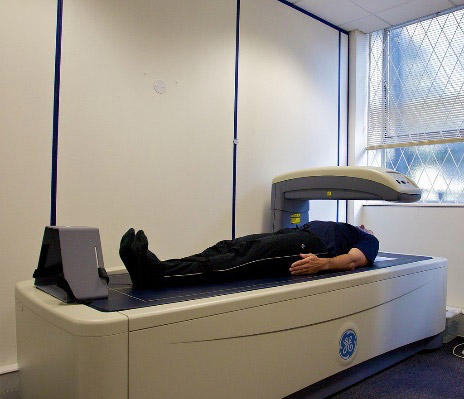
Figure 3. Dual x-ray absorptiometry (DXA) machine.
[Source: Nick Smith photography.https://en.wikipedia.org/wiki/Dual-energy_X-ray_absorptiometry#/media/File:DEXA_scanner_in_use_ALSPAC.jpg]
DXA uses x-rays that are absorbed differently by fat and fat-free mass components like bones. The x-ray beams pass through the body, and the beams that aren't absorbed are detected on the other side. In this way, DXA can precisely measure body composition.
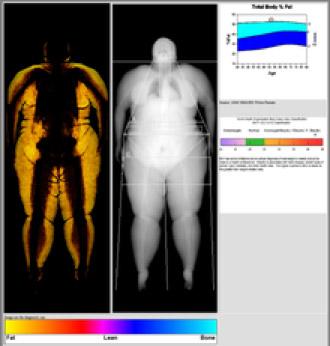
Figure 4. Result of body composition using DXA scan. The yellow color represents fat tissue.
[Source: https://en.wikipedia.org/wiki/Dual-energy_X-ray_absorptiometry#/media/File:Picture1_fs.png]
A second method to measure body composition is
bioelectric impedance analysis (BIA).
This employs a similar concept to DXA but uses electrical impulses instead of x-rays. For this reason, BIA offers an accessible, cost-effective way for anyone to measure their body composition. Machines that use BIA look like a standard scale but give you a much more accurate picture of your health.
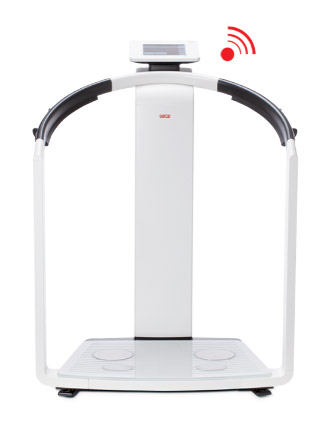
Figure 5. Scale that measures body composition via bioelectric impedance analysis used in Dr. Gepner's laboratory.
[Source: https://www.seca.com/en_us/products/body-composition-analysis/ seca-mbca-advantages/seca-mbca-514515.html]
It is important to note that the definition of excess fat mass has not yet been standardized. For this study, Dr. Gepner and colleagues defined excess body fat as greater than 25% in men and greater than 35% in women. It is normal for women to have more body fat than men for a variety of physiological reasons.
Comparing BMI, Body Composition, and Waist Circumference
To better understand how body composition measurement could impact healthcare, Dr. Gepner and colleagues conducted a study that included 3,001 Israeli adults between the ages of 20 and 95 years of age who attended a nutrition clinic in the center of Israel between 2015 and 2021. To begin, the researchers took a variety of measurements and images of participants including height, weight, waist circumference, and a DXA scan. Recent results of blood tests within six months of the study visit were obtained through medical records including blood sugar, cholesterol, and liver levels. The results of these blood tests were used to assess participants' risk of developing obesity-related diseases. Height and weight were used to calculate BMI. The researchers compared the results of BMI, waist circumference, and DXA scan with the blood test results to determine which tools were most accurate.
When participants were classified based on BMI, 967 were considered normal weight. However, despite their normal weight, 26% of men and 38% of women in this group had excess fat tissue consistent with obesity according to their DXA scans. In other words, one-quarter of men and one-third of women thought they were healthy based on their BMI but were actually at increased risk of heart disease and other health problems due to their excess fat content. "This is a very significant finding," commented Dr. Gepner. "By using BMI as an estimate for obesity, we are missing potentially millions of people who are at increased risk for a host of health problems but don't know it."
On the other hand, of the 1,056 participants classified as overweight, 30% of men and 10% of women had normal body composition and fat content according to their DXA scans. In other words, although they had excess weight, these individuals were not at increased risk for health problems associated with obesity. "These individuals are being misdiagnosed as overweight and sent for additional testing that they don't need," added Dr. Gepner.
There are many reasons that different people with the same body weight have a wide range of body compositions including genetic factors, loss of muscle mass with aging, differences in body shape, diet, and level of exercise. Measurement of body composition takes these factors more directly into account than BMI.
Watch Your Body Composition
Based on the results of this research, Dr. Gepner recommends the measurement of body composition—through DXA scan or BIA—to assess obesity and an individual's risk for developing obesity-related diseases more accurately.
Despite many people trying to lose weight, over 80% of those who succeed end up gaining the weight back. This cycle of weight loss and gain leaves individuals less healthy. As you lose weight, you usually lose both fat and muscle mass; however, as you gain weight, you tend to gain mostly fat mass. Every cycle of weight loss and gain leaves you with increased fat and worse metabolism.
Dr. Gepner emphasizes that we can all be much healthier by exercising and eating a healthy diet without losing weight. In fact, exercise does not always lead to weight loss, but this expectation can make us less healthy by increasing fat mass through multiple weight cycles and discouraging us from starting to exercise at all.
If we are expecting to lose weight due to exercise, it can be very discouraging when the pounds aren't dropping, and many people stop as a result. "Our research shows that even if you don't lose weight, exercise is critically important," added Dr. Gepner. This is because exercise changes body composition and leads to a decrease in excess fat even without a decrease in weight. "Imagine that we had a scale that could show your percentage body fat dropping weekly after starting an exercise regimen," added Dr. Gepner. "People would feel so encouraged!" Indeed, these machines do exist, and Dr. Gepner hopes that their use in clinics, gyms, and other public places will revolutionize how we think about weight and exercise.
Next steps
In future research, Dr. Gepner hopes to continue to find the most accurate measurements for obesity and predictors of future health outcomes.
One ongoing project seeks to identify which organs are most predictive of overall health status in children and adolescents. Excess body fat can be so damaging because fat molecules do not remain just in fat tissue. When there is too much body fat, the fat molecules start to infiltrate other organs, such as the liver and heart. Using DXA imaging, Dr. Gepner and his team can visualize fat deposits in fat tissue and in other body organs.
Dr. Gepner has a simple message for all readers who might be concerned about obesity in themselves or loved ones: "You can be healthy at any weight by exercising and eating a healthy diet. Don't wait - start today."
Dr. Yftach Gepner is Professor in the School of Public Health at Tel Aviv University in Tel Aviv, Israel. He is an epidemiologist and exercise physiologist by training, and his research focuses on understanding how exercise and diet impact our health. When not in the laboratory, Dr. Gepner enjoys playing tennis, hiking, and snowboarding.
For More Information:
- Lahav, Y. et al. 2023. “The paradox of obesity with normal weight; a cross-sectional study.” Frontiers in Nutrition. 10:1173488. https://www.frontiersin.org/articles/10.3389/fnut.2023.1173488/full
- Keys, A. et al 1972. “Indices of relative weight and obesity.” Reprinted in: International Journal of Epidemiology, 43(3): 655-665; 2014. https://doi.org/10.1093/ije/dyu058
- Blackburn, H. and Jacobs Jr., D. 2014. “Commentary: Origins and evolution of body mass index (BMI): continuing saga.” International Journal of Epidemiology, 43(3): 665-9. https://academic.oup.com/ije/article/43/3/665/2949550
To Learn More:
BMI and Body Composition
- Gepner Lab. https://www.gepnerlab.com/
- “AMA adopts new policy clarifying role of BMI as a measure in medicine.” American Medical Association. https://www.ama-assn.org/press-center/press-releases/ama-adopts-new-policy-clarifying-role-bmi-measure-medicine
- Centers for Disease Control and Prevention. https://www.cdc.gov/healthyweight/assessing/bmi/index.html
Obesity
- Centers for Disease Control and Prevention. https://www.cdc.gov/obesity/index.html/
- European Association for the Study of Obesity. https://easo.org/media-portal/statistics/
- World Health Organization. https://www.who.int/health-topics/obesity#tab=tab_1
Written by Rebecca Kranz with Andrea Gwosdow, PhD at www.gwosdow.com
HOME | ABOUT | ARCHIVES | TEACHERS | LINKS | CONTACT
All content on this site is © Massachusetts
Society for Medical Research or others. Please read our copyright
statement — it is important. |