Highlights
The Visual Word Form Area (VWFA) is an area of the brain that processes written language. To understand whether the VWFA functions differently depending on the language being read, these researchers conducted experiments to observe the brain function of English-French and English-Chinese bilingual volunteers.
The results showed important differences in VWFA function between English and Chinese. Specifically, the researchers identified regions of the VWFA that were only activated by Chinese and not English. Interestingly, these regions were also highly activated when processing faces. The researchers hypothesize that these results are related to the way readers receive visual information from Chinese characters.
Future research will focus on similar experiments with additional language pairs that have distinct written and linguistic features.
Did you know that there are an estimated 7,000 languages spoken by humans around the world? Approximately half of these languages have no written form. Those that do have a written form use a total of about 30 different writing systems. These writing systems can be loosely divided into alphabetic systems and
logographic
systems.
Alphabetic writing systems use different letters to represent sounds of the language. Examples of alphabetic systems include the Latin alphabet used in English and other romance languages (Spanish, French, Italian), Hangeul used in Korean, and Cyrillic used in Russian, just to name a few.
In contrast, logographic writing systems use characters to represent concepts or ideas, not solely based on their pronunciation. The primary logographic writing system in use today is Chinese and writing systems derived from Chinese. Egyptian cuneiform and Mayan glyphs are two ancient examples of logographic writing systems.
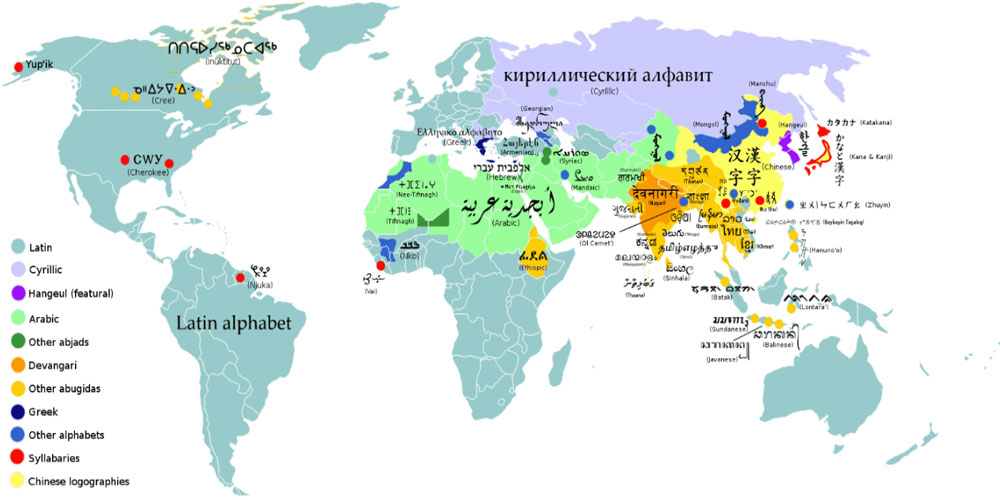
Figure 1. Map of major writing systems of the world today. Latin script refers to the alphabet you are reading right now. Cyrillic is the family group that includes Russian. Hangeul is the alphabet used in Korean. Abjads refers to writing systems that only include consonants, such as Arabic and Hebrew. Devangari refers to the script used in many languages on the Indian subcontinent including Hindi. Abugida is the family of languages including Devangari that use consonant-vowel pairings.
[Source: https://en.wikipedia.org/wiki/List_of_writing_systems#/media/File:World_alphabets_&_writing_systems.svg]
No matter the language, the process of learning to read involves training the brain to recognize specific characters that convey meaning, either alone or in combination. It is unknown whether different writing systems may activate the brain in different ways. This is one of the questions under investigation in the laboratories of Professor Laurent Cohen at the Institut du Cerveau, Paris Brain Institute (ICM) in Paris, France and Professor Stanislas Dehaene at the NeuroSpin Imaging Center, The French Alternative Energies and Atomic Energy Commission (CEA) in Paris-Saclay, France.
Reading and the Visual Word Form Area
Professors Cohen and Dehaene conducted research over 20 years ago that first identified a specific area of the brain involved in reading, known as the Visual Word Form Area (VWFA).
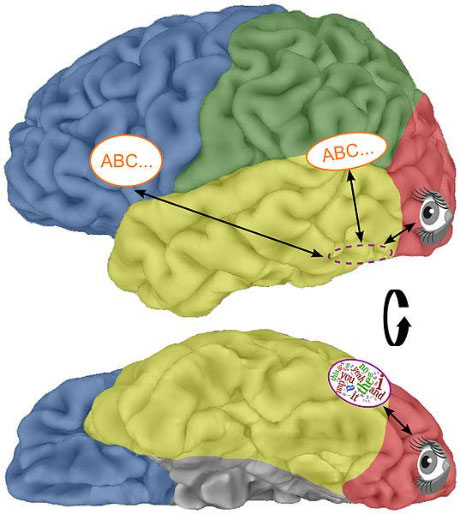
Figure 2. Location of the Visual Word Form Area as seen from the side (top) and the bottom of the brain (bottom).
[Source: https://commons.wikimedia.org/wiki/File:Visual_word_form_area1.jpg]
The VWFA is located just behind the ear, mostly on the left side of the brain near a structure called the fusiform gyrus. Multiple other visual categories are also processed nearby such as faces, bodies, and houses. Previous experiments to further understand the functions of the VWFA have shown increased activity of this brain region as strings of letters become more and more similar to real words.
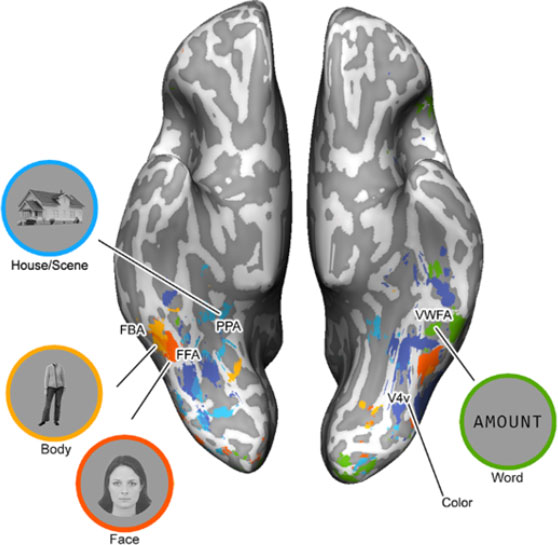
Figure 3. Regions of the brain activated by different stimuli, as identified by the researchers. Regions include the parahippocampal place area (PPA) activated by houses and scenes; the fusiform body area (FBA) activated by bodies; the fusiform face area (FFA) activated by faces; and the Visual Word Form Area (VWFA) activated by words. This view shows the brain from the bottom up.
[Source: Dr. Zhan]
Dr. Minye Zhan joined Professor Dehaene’s laboratory in 2018 as a postdoctoral research fellow. In her doctoral work, Dr. Zhan investigated how the brain recognizes faces and processes body language. In Professor Dehaene’s laboratory, she focused on differences in how the VWFA processes written language in people who are
bilingual.
This research was conducted by scanning participants with a noninvasive imaging technique called
functional magnetic resonance imaging
(fMRI) and analyzing the resulting brain signals. Standard MRI technology in hospitals uses the magnetic properties of different tissues in the body to visualize our internal anatomy in three-dimensional images. Each
pixel
in the 3D data is called a
voxel
(pixel in volume).
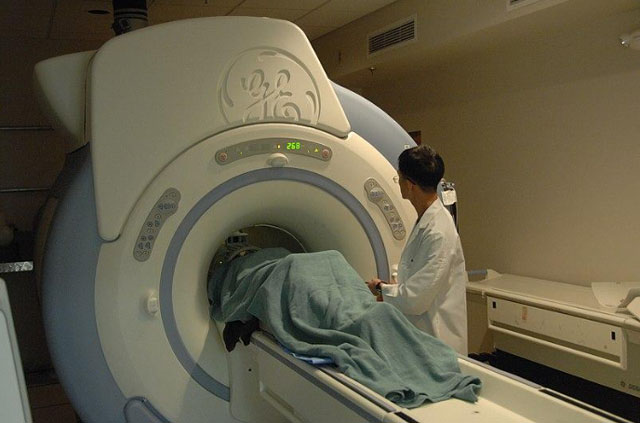
Figure 4. A patient entering an MRI machine.
[Source: https://en.m.wikipedia.org/wiki/File:MRI_machine_with_patient_(23423505123).jpg]
fMRI allows researchers to not only visualize brain anatomy but also to identify the function of different regions of the brain by adding a fourth dimension: time. During an fMRI scan, the machine takes images at specific time intervals, such as every two seconds. This allows the researchers to compare brain activity in the scans of the same brain over time to investigate changes. For example, the researchers can identify which parts of the brain are activated according to a given visual stimulus, such as a string of letters. If a certain brain area is activated across multiple participants with the same stimulus, the researchers can infer that this brain area is involved in the function represented by the stimulus.
The resolution and quality of an MRI image depend on the strength of the magnet used. The measurement unit of the
tesla
(T) is used to indicate the strength of a given magnet. For reference, a regular refrigerator magnet has a strength of 0.005T. In hospitals and imaging centers today, MRI machines typically have a magnetic strength of 1.5T or 3T. Previous iterations of this experiment in Professors Cohen and Dehaene’s laboratories used a 3T machine. For the experiments described here, the researchers used a 7T machine, allowing for images with much higher resolution than in previous studies.
Scanning Bilingual Brains
For this study, Dr. Zhan and colleagues recruited two sets of bilingual participants: English-French bilinguals and English-Chinese bilinguals. The researchers chose to conduct similar experiments with two language pairs to see whether the similarity of the languages affected brain activity. English and French are similar to each other, and both use the Latin alphabet. On the other hand, English and Chinese are very distinct languages and use completely different writing systems, one alphabetic and one logographic.
The individuals who volunteered to participate in this research were enrolled based on their self-identified language learning environments and experiences. The 21 English-French bilinguals were grouped as English-dominant, French-dominant, or equally dominant in English and French. An additional 10 English-Chinese bilinguals were Chinese-dominant. To confirm participants’ self-reported language dominance, the researchers asked participants to complete a one-minute reading test in both English and their other language (either French or Chinese). All participants agreed to perform various tasks as indicated by the researchers while they were inside the fMRI machine. The tasks involved looking at various materials, called “stimuli.”
In the first task, Dr. Zhan showed the English-French bilingual participants a variety of stimuli at a fast pace to see how their brains would react. These stimuli included faces, bodies, objects, numbers, French words, and English words. The researchers also included what they called “false fonts,” meaning symbols that look like they could be letters but are not. The purpose of this task was for researchers to find brain areas specifically involved in the processing of words, including the previously identified VWFA. These areas would be identified because they would show much higher activity for the words compared to the other stimuli.
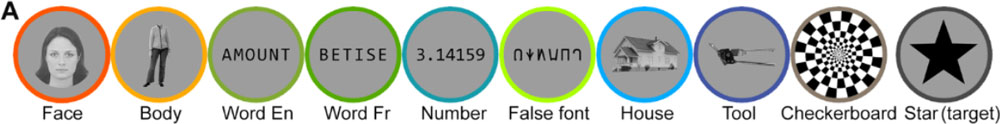
Figure 5. Different stimuli shown to participants during the fMRI scan to determine the brain areas most sensitive to words.
[Source: Zhan et al, 2023, Fig. 1a]
This experiment was conducted according to a standardized procedure for each individual participant. First, Dr. Zhan presented the visual stimuli to the participant in random order for a fixed amount of time. The fMRI scanned the participant’s brain every two seconds.
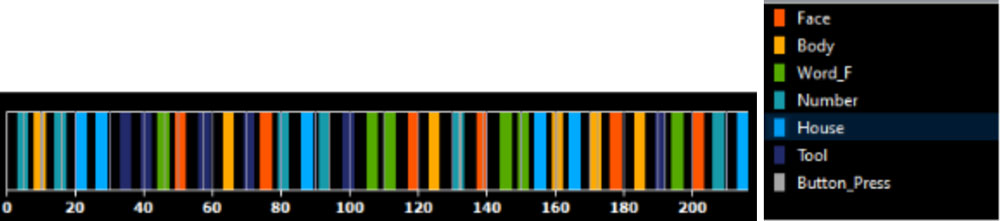
Figure 6. The duration of the fMRI scan labeled based on the stimuli that was shown. The numbers on the x-axis represent the number of two-second time intervals. For example, 20 intervals equals 40 seconds. The colors indicate the type of stimulus presented in each interval.
[Source: Dr. Zhan]
Next, Dr. Zhan modeled what the researchers expected the brain activity would look like according to the stimulus presented. In the example below, the model shows expected brain activity when the stimulus is faces (red).
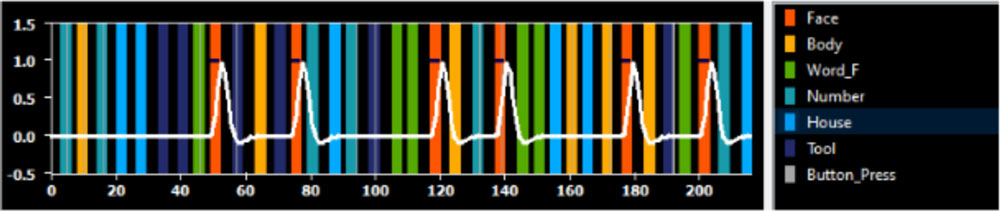
Figure 7. The duration of the fMRI scan labeled with stimuli and modeled to show what brain activity (white line) is predicted to look like when faces (red) are shown.
[Source: Dr. Zhan]
Finally, Dr. Zhan checked each pixel of the data (Figure 8) for brain activity that matched the model (Figure 7). For example, in Figure 8, the activity from the brain region colored red (left) is most similar to the model of brain activity when viewing faces (right). This result indicates that the brain region shown in red is involved in processing faces.
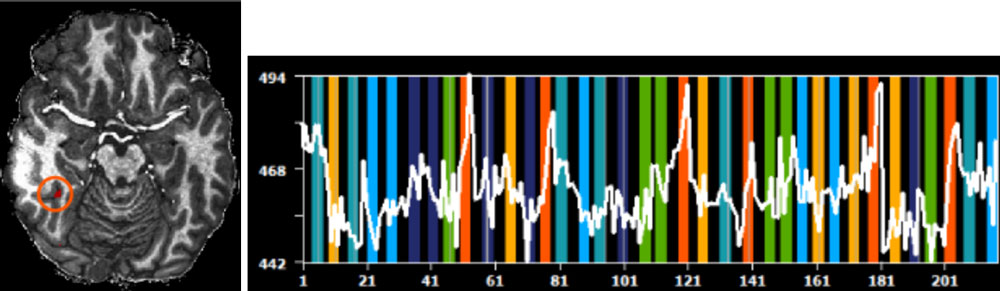
Figure 8. The activity from the brain region colored red (left) is most similar to the model of brain activity when viewing faces (right). This result indicates that the red brain region is involved in processing faces.
[Source: Dr. Zhan]
In this way, Dr. Zhan generated a map containing all the areas activated by each type of stimulus. She focused on the areas activated by words. To find out which of these brain areas were most important in processing written words, Dr. Zhan asked participants to perform a second task.
In the second task, participants were shown a variety of different word-like stimuli. These are strings of letters that become more and more similar to words. Whether a string of letters appears word-like depends on how frequently the component letters and letter combinations appear in a given language.
In addition to letter frequencies, letter combinations also have frequencies as a property of the language. Combinations of two letters are called bigrams and those of four letters are called quadrigrams. In English, common bigrams include “th” and “nd,” and common quadrigrams include “ould” and “ight.”
In this task, Dr. Zhan showed participants word-like stimuli that contained strings of letters, bigrams, and quadrigrams. These were rated as either high frequency or low frequency based on their occurrence in both English and French.
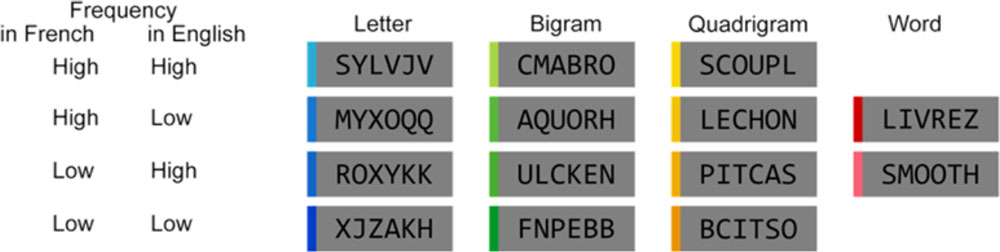
Figure 9. Strings of letters become more word-like based on the frequency of the letters, bigrams, and quadrigrams in each language.
[Source: Zhan et al, 2023, Fig. 1b ]
By showing word-like stimuli that appeared closer and closer to words, Dr. Zhan tested the word-sensitive areas identified in the previous task for their sensitivity to word component frequency. The specific areas that showed increased sensitivity as the stimuli became more word-like were the ones most involved in processing written words.
The Challenges of Data Analysis
After obtaining the data from the fMRI scans of the participants, the next step was data analysis. In standard fMRI analysis, all participants are analyzed together. This is done to ensure the observed effects are likely to remain true at the population level and not just for the specific participants being scanned.
In order to analyze the data together, the researchers must adjust each individual scan. Because the specific anatomy of each individual person can vary, researchers typically fit each participant’s brain to the size of a standard brain template. Additionally, the researchers need to blur the individual participant’s data to achieve better overlap across participants. Having adjusted the data in this way, the researchers can test whether a specific voxel, as marked by x, y, and z coordinates, is activated in all participants.
When Dr. Zhan tried to standardize the data in this manner, it did not work. Although she could see a chain of areas robustly activated by words at the individual level, this region completely disappeared in the standardized group analysis due to the anatomical variability between the brains of the participants. Moreover, blurring the regions negated the increased resolution gained by using a 7T fMRI machine.
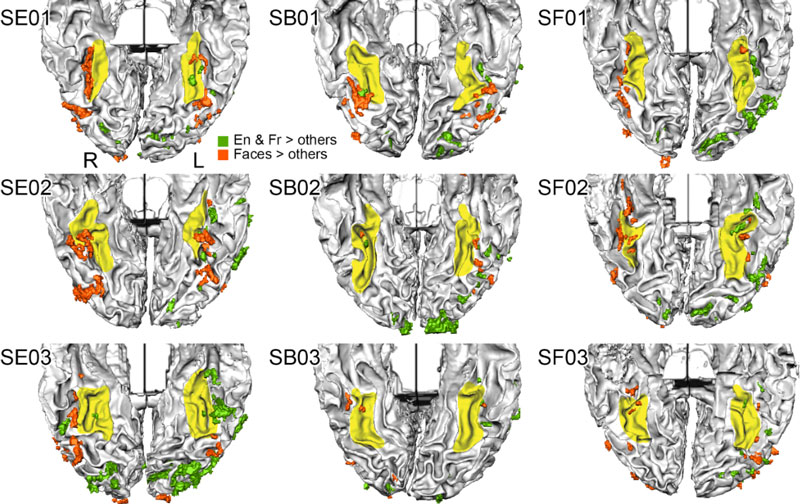
Figure 10. The brains of nine individual English-French bilingual participants. Yellow indicates the fusiform gyrus, a structure in the brain near the VWFA; green indicates the areas activated by English and French words; red indicates areas activated by faces. Notice how each brain shows activated areas lying in the vicinity of the fusiform gyrus, but their specific locations vary. This variation made the group-level activation disappear when using traditional group analysis.
[Source: Dr. Zhan]
To overcome the challenge of group data analysis, Dr. Zhan turned to a method used by
neurologists
when testing the electrical activity in the brains of patients with
epilepsy.
Rather than smoothing the brain maps, Dr. Zhan combined the areas found across all individual participants into one “super-participant” that could be used for group analysis.
To do this, Dr. Zhan first computed a slope that indicated the increase in brain activity for a given area as the word-like stimulus became more and more similar to real words. A steeper slope indicated a more dramatic increase in activity.
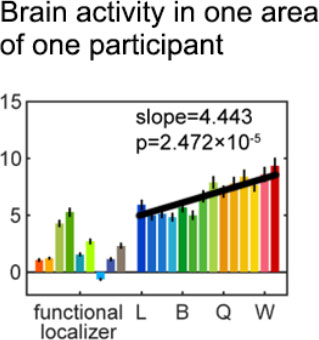
Figure 11. To analyze all participants together, Dr. Zhan first computed a slope (black line) for each word-sensitive area of each participant.
[Source: Dr. Zhan]
Next, Dr. Zhan repeated this process for each area of activity in the brain. The location of the brain activity was shown by the location of the dot on the image, and the steepness of the slope was indicated by different colors.
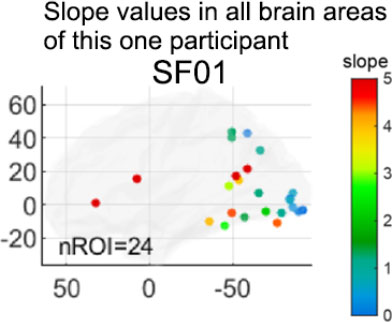
Figure 12. Slope values for all brain areas in a single participant. In this participant, there were 24 areas of brain activity, as indicated by nROI=24.
[Source: Dr. Zhan]
Finally, Dr. Zhan combined all the dots of each participant together to represent a “super-participant.” In this way, she could examine the change of the slope of the whole group without blurring the individual brain maps.
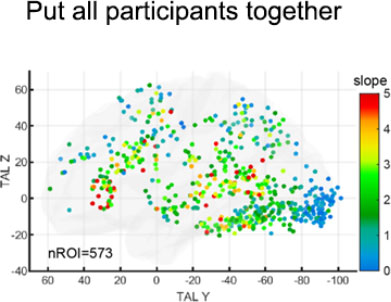
Figure 13. Dr. Zhan combined all the dots of each participant together to represent a “super-participant.”
[Source: Dr. Zhan]
Analyzing the data this way revealed a clear gradient across the bottom of the brain: areas closer to the front of the brain had increasingly steeper slopes.
Results
One important result of these experiments is that the VWFA in individual brains is located not just in one or two areas but in a chain of areas. This can be seen in the green areas of the brain in Figure 10. Since the change of activity across these areas is gradual (Figure 13), it is hard to pinpoint which exact area corresponds to the VWFA previously found in the literature. Thus, Dr. Zhan examined all the green (word-specific) areas together.
Dr. Zhan hypothesized that there might be a difference in activation of word-specific areas between different languages for both English-French bilinguals and English-Chinese bilinguals. Surprisingly, the results showed no difference in processing between English and French words. “This doesn’t mean that the two languages are not interpreted differently in other parts of the brain,” remarked Dr. Zhan, “but in the visual areas around the fusiform gyrus, we did not find any differences in activation.”
In contrast, Dr. Zhan noticed important differences in the word-specific areas when English-Chinese bilinguals read English versus Chinese. Specifically, the researchers identified regions that were only activated by Chinese and not English. These regions showed higher and higher activity for stimuli more similar to real Chinese words but had little activity change no matter how close the stimuli came to real English words. Interestingly, these regions also showed very high activity for faces, which was not found in previous research.
Dr. Zhan believes these results are related to the way that readers receive visual information from Chinese characters. Readers of Chinese and readers of alphabetic languages process the visual information together rather than as component parts, which is called holistic processing. Holistic processing is also involved in processing visual information from faces. Rather than focus specifically on what someone’s eyes or nose or cheek bones look like, we take in all this information together to recognize a face. Dr. Zhan hypothesizes that Chinese readers utilize holistic processing more strongly than English or French readers for reading Chinese scripts.
This study begins to answer important questions about how the VWFA processes visual and linguistic information. There is still much more to be done to better understand how the VWFA functions and what other impacts bilingualism may have on the brain. In future research, Dr. Zhan is planning similar studies with other language pairs that have distinct written and linguistic features. For example, English and Russian are both alphabetic languages but use different scripts. Another example is English and Hebrew, which are both alphabetic languages but are read in different directions: English is read left to right while Hebrew is read right to left. Another interesting case to study is Japanese, where the written language uses both alphabetic script, syllabary script, and logographic characters. In addition, ongoing studies will take advantage of the newest generation of MRI technology using an 11.7T magnet that will provide even higher resolution.
Dr. Minye Zhan is a researcher in the laboratory of Professor Stanislas Dehaene at the NeuroSpin Imaging Center, National Institute of Science and Medical Research in Saclay, France. She is a specialist in high-resolution human fMRI experiments. In addition to her work in the laboratory, Dr. Zhan is a professional artist who publishes under the name Jane Mere. You can find a portfolio of her work here.
Professor Laurent Cohen is Professor of Neurology at the hospital Hôpital de la Salpêtrière in Paris, France and Director of the PICNIC lab at the Institut du Cerveau, Paris Brain Institute (ICM) in Paris, France. His research focuses on improving our understanding of brain function during learning and reading. Prof. Cohen splits his time between research, teaching, and seeing patients.
Professor Stanislas Dehaene is Professor of Experimental Cognitive Psychology at College de France and Director of the NeuroSpin Center and its Cognitive Neuroimaging Unit. He is a world-leading expert in numerical cognition, consciousness, and the neural basis of reading.
For More Information:
- Zhan, M. et al. 2023. “Does the visual word form area split in bilingual readers? A millimeter-scale 7-T fMRI study.” Science Advances, 9(14). https://www.science.org/doi/10.1126/sciadv.adf6140
- Vinckier, F. et al. 2007. “Hierarchical Coding of Letter Strings in the Ventral Stream: Dissecting the Inner Organization of the Visual Word-Form System.” Neuron, 55(1): 143-56. https://www.sciencedirect.com/science/article/pii/S0896627307004503
- Cohen, L. et al. 2000. “The visual word form area: Spatial and temporal characterization of an initial stage of reading in normal subjects and posterior split-brain patients.” Brain, 123:291-307. https://academic.oup.com/brain/article/123/2/291/346042?login=true
To Learn More:
- Laurent Cohen. https://institutducerveau-icm.org/en/member/?user=987
- Stanislas Dehaene.https://royalsociety.org/people/stanislas-dehaene-36217/
https://www.nasonline.org/member-directory/members/20022445.html
- Sutherland, S. “When we read, we recognize words as pictures and hear them spoken aloud.”https://www.scientificamerican.com/article/when-we-read-we-recognize-words-as-pictures-and-hear-them-spoken-aloud/
Written by Rebecca Kranz with Andrea Gwosdow, PhD at www.gwosdow.com
HOME | ABOUT | ARCHIVES | TEACHERS | LINKS | CONTACT
All content on this site is © Massachusetts
Society for Medical Research or others. Please read our copyright
statement — it is important. |